Time series plots estimating the fraction of green cover from Landsat for the eight transect locations at the four field sites (see map p.6) in the NT (sites 1 and 2) and Qld (sites 4 and 5) from 1987 to 2020. The red line indicates the synchronous timing of the late 2015 mass dieback event. The widespread impact was coincident with the widespread, dramatic and sudden temporary drop in sea level registered in local port tide gauge records. Note that green fraction cover starts low in 1987 and then recovers – another piece of evidence for a previous dieback event in the 1980s.
The significance of the mass dieback event was not recognised until early 2016 when images taken by local fishermen and environmental consultants showed the extent of mangrove death at a number of sites on both sides of the Gulf. Such an occurrence had never been reported before, and the cause was not immediately recognised. The Australian Government’s National Environmental Science Program (NESP) funded James Cook University to conduct an urgent three-year research investigation into the mass dieback.
We undertook aerial surveys and mapped the Gulf’s shorelines to quantify the extent of the dieback; assessed estuaries by scoring changes to mangroves and tidal wetlands; and identified ongoing and emerging environmental issues that threaten mangrove ecosystems. We worked with local communities and Indigenous ranger groups from the Carpentaria Land Council Aboriginal Corporation in Queensland and the Mabunji Aboriginal Corporation in the Northern Territory.
The 2015 dieback event was synchronous along approximately 2,000 km of the Gulf’s coastline, killing more than 7,650 ha of mangroves. In 2015–2016, extreme high temperatures and prolonged drought conditions associated with a severe El Niño event affected the Gulf. However, these extreme weather conditions were not considered sufficient to so severely damage mangroves.
The upper edges of the mangrove zone, where mangroves at higher elevations border the saltpan–saltmarsh zone, were most affected by dieback. This indicated that the dieback event was connected to differences in elevation and changes in sea level. The El Niño event caused a sudden drop in sea levels across the western Pacific, with extreme drops in seawater levels of 30–50 cm recorded in three ports at Milner Bay on Groote Eylandt (NT), Karumba and Weipa (Queensland).
It is significant that mass mangrove dieback only occurred in the vicinity of Karumba, and not near the other Gulf ports. The drop in mean sea level at Karumba was especially severe with lowest extreme levels of around 40–50 cm averaged over the six-month period from April to October 2015. The death of mangroves growing at the upper edges of the mangrove zone led to a seaward shift of the ecotone between the saltmarshes and mangroves to an elevation approximately 40–50 cm lower – matching the drop in sea level at the port. The drop in sea levels induced severe moisture stress in the mangroves growing at higher elevations, and this led to their death. The dominant canopy species, Avicennia marina var. eucalyptifolia was particularly affected, noting that these forest stands typically have a functional root depth around 50 cm.
A ‘stress index’, combining severity and duration of the drop in sea level, was estimated from tide gauge records from three Gulf ports – Milner Bay (Groote Eylandt) in the NT, and Karumba and Weipa in Qld for 1995 to 2018. The 2015–2016 event was notably most severe in the Karumba area (>2 on the stress index) – noting this was the only port of the three to be in close proximity to an area of severe or moderate mangrove dieback in 2015–2016.
Whilst conducting these investigations into the 2015 mass dieback event, we also discovered an earlier comparable occurrence of mass mangrove dieback in late 1982. Both events, 33 years apart, were associated with particularly severe El Niño weather conditions – each causing extreme drops in sea level of up to 40–50 cm for extended periods of 5 to 6 months. It is believed that this almost certainly confirms that higher placed mangrove stands died from a lack of seawater wetting. However, this situation was undoubtably exacerbated by both the extreme high temperatures and prolonged drought conditions observed in 2015–2016.
Finding evidence for the earlier mass dieback was made difficult by the remoteness of the region and the lack of anecdotal accounts, sea level data and historical aerial imagery. Therefore, several lines of enquiry were needed to confirm the discovery. These included available aerial imagery in 1978 and 1987–1989, measures of canopy density from the commencement of Landsat vegetation index (NDVI) readings in 1987–2020, uniquely comparable severe weather and sea level conditions in 1982 and 2015 as correlates also with the Southern Oscillation Index, and the size and age classes of mangrove canopy trees across the region.
This time series comparison shows losses of shoreline mangroves (in false red colour) as seen in Landsat imagery. These compare the known 2015–2016 incident (right) with those likely much earlier between 1978 and 1989 (left), coincident with a severe El Niño event in late 1982. These views show the same severely impacted shoreline just east of the Limmen Bight River mouth (field site 1).
Sea level rise is reducing the available area of mangrove habitat
Sea level rise has been relatively rapid in the Gulf region between 1993 and 2007, with rates of up to 12 mm/yr exceeding the global average by around 8 mm/yr. Shoreline erosion caused by rises in sea level had led to the loss of mature vegetation at lower elevations along the seaward fringe. Expansion of younger trees were notable in higher elevation zones.
Rising sea levels also lead to sheet erosion in saltpans, gully erosion, the loss of saltmarsh vegetation and terrestrial retreat, whereby saline intrusion kills terrestrial trees in areas above the highest astronomical tides. The severity of mangrove dieback in the 37 estuaries we scored was strongly correlated with rising sea levels, especially terrestrial retreat and saltpan scouring.
Two severe cyclones occurred between the 2017 and 2019 aerial surveys. Tropical Cyclone Owen (Category 3) affected the area west of the Limmen Bight estuary and shoreline in December 2018, and Tropical Cyclone Trevor affected the Robinson, Calvert and Wearyan estuaries in March 2019. The collective impact of these storms caused serious damage to at least 600 km of Gulf shoreline. The types of damage ranged from shoreline erosion and retreat, sediment wash, root burial, dieback, new seedlings being scoured by wrack piles of trees that died in 2015, large patches of fallen and broken stems, and defoliation of the canopy.
In February 2019, severe flooding of the Flinders River further caused significant damage to estuarine tidal wetlands, including bank erosion and slumping, scouring and gullying in saltpan–saltmarsh areas and sediment deposition on seafront mudbanks where mangrove seedlings had become tentatively established in 2019.
The accumulation of impacts from tropical cyclones and flooding is likely to seriously impede, or even reverse, recovery in areas that are affected repeatedly.
![]() |
![]() |
The impact of Category 3 Tropical Cyclone Owen in December 2018 on the 2015–2016 dieback areas of the Limmen shoreline – the photo on the left was taken in September 2018 and the photo on the right in September 2019. Standing dead stems and seedling recruits have been scoured and dumped inland. Note the piles of wood wrack evident as grey patches in the centre foreground and extending into the distance in the ‘after’ photo.
A longer term collapse and recovery cycle in the Gulf
Based on our new findings, the distinctive, seemingly depauperate characteristics of mangrove stands in the
Gulf can now be better explained. The newly recognised occurrence of a collapse–recovery cycle describes the processes that have shaped and formed key features of these mangroves including species biodiversity, stand structure, tree ages, biomass, and general appearance – as well as their role in nurturing dependent animals like commercial fish and crab stocks. This cycle in the Gulf is defined by the two severe collapse events of mass dieback 33 years apart in 1982 and 2015 (see green fraction plots, p.2).
These events have left the recovering shorelines highly vulnerable. Recovery following the earlier event was notably successful but this took around 15–20 years depending on subsequent damaging, localised weather events like cyclones and flooding. Canopy maturity in most areas was achieved 10–15 years before 2015 after which the current recovery phase was initiated. It is of primary interest that the 1982 damage had recovered naturally. However, since then several key driving factors have changed, notably the rising sea levels and the occurrence of more severe weather events. The expected increases in more damaging events means that the same recovery outcome cannot be guaranteed. And, there are also pertinent questions about the occurrence and increased frequency of future collapse events.
Dead trees like these near Karumba were later scoured and piled up as piles of wood wrack (see images above).
Changing environmental conditions have the potential to pose severe and long-term threats to mangrove survival in the Gulf of Carpentaria. Strategies to ensure the long-term health and resilience of mangrove ecosystems can be pursued at the local, national and global scale. To be most effective, these strategies should be enacted concurrently:
This diagram depicts characteristics used in the field studies to define elevations and distances along transects as vegetation ecotones along the upper half of the tidal range – the niche of the tidal wetland zone. The profile images depict a typical Gulf of Carpentaria shoreline, before and after the severe impact of the 2015–2016 dieback of the seaward mangrove fringe. Mangroves at the upper edge of the mangrove zone (M2-upper ecotone) died, shifting that ecotone 40–50 cm lower in elevation, to the M2-dead/live ecotone position.
The locations of the four field study sites in the Gulf of Carpentaria representing the affected shorelines from Queensland to the Northern Territory. Also shown are the 37 estuaries surveyed in the six regional drainage areas, from Mission River in Weipa, Qld, to Koolatong River in Blue Mud Bay, NT. A pdf version of the map is available here.
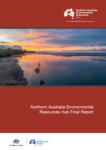
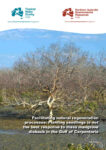
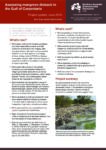
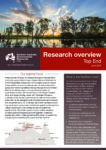
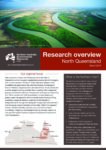
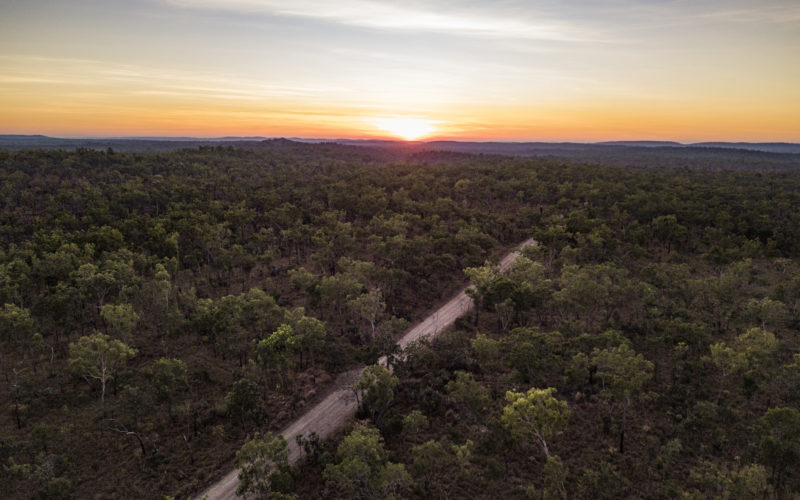
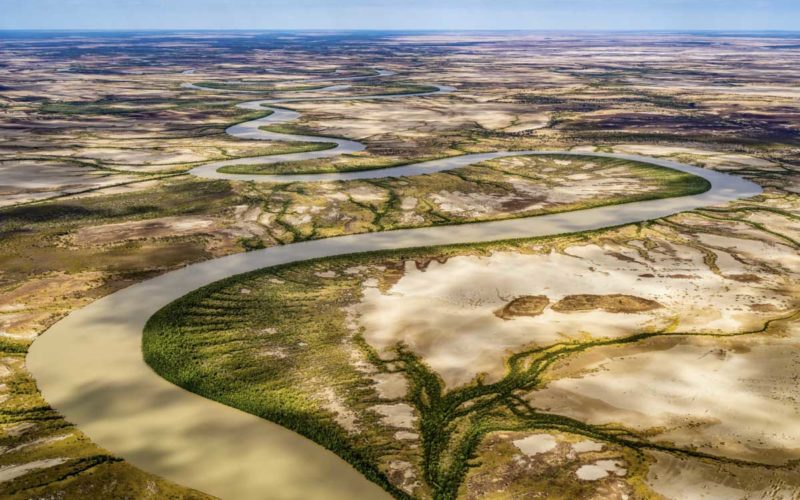
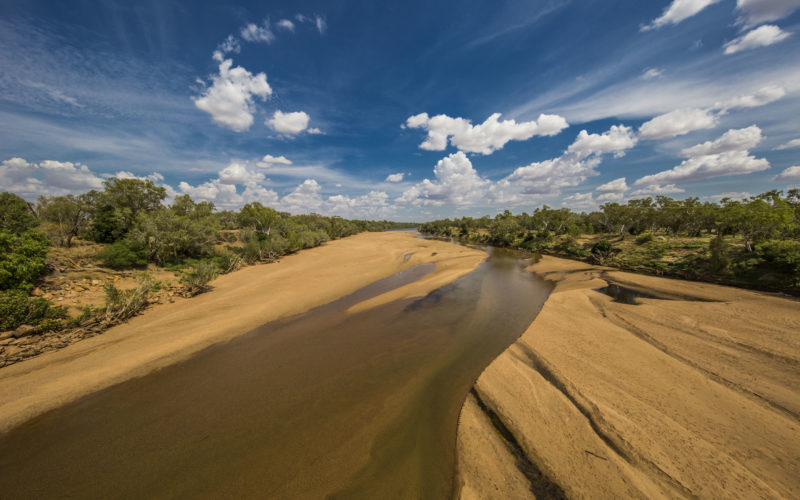
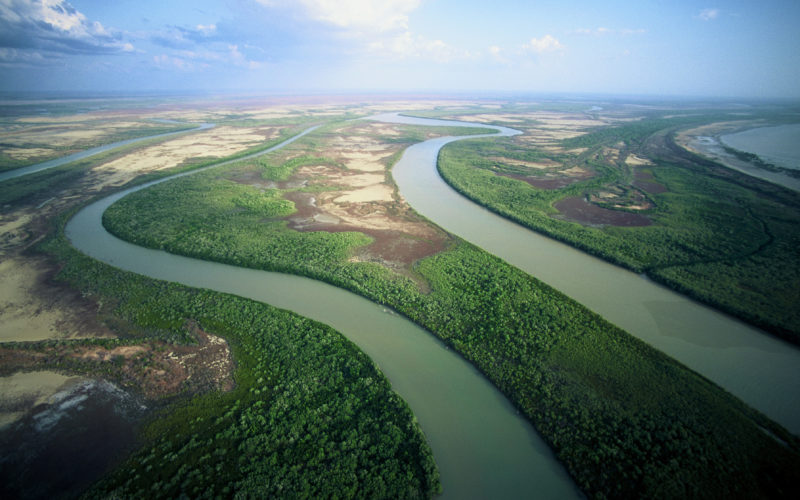
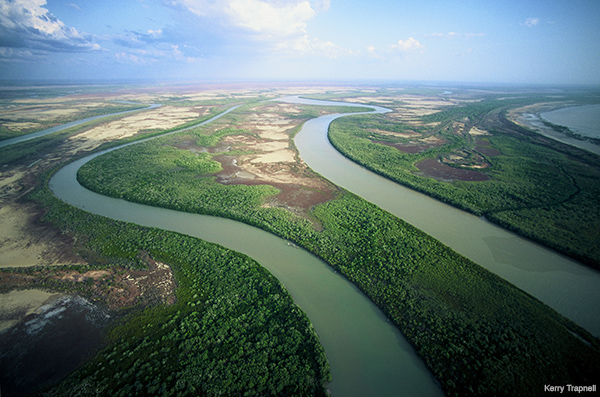
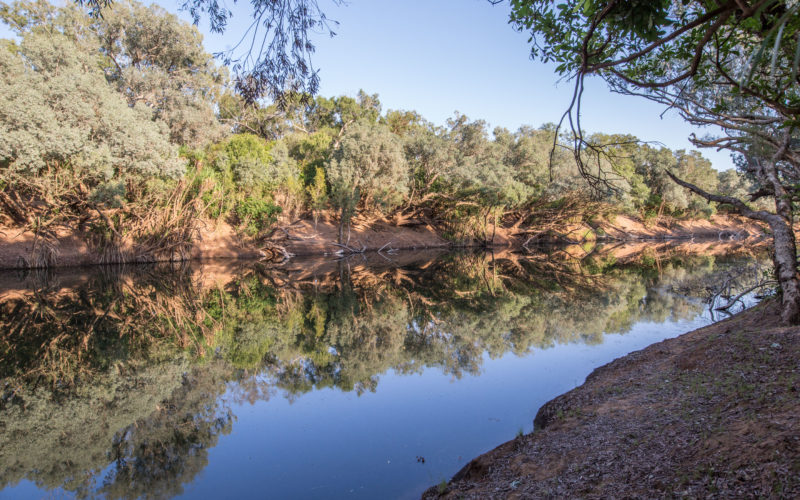
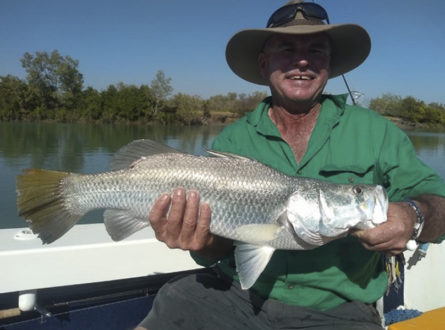
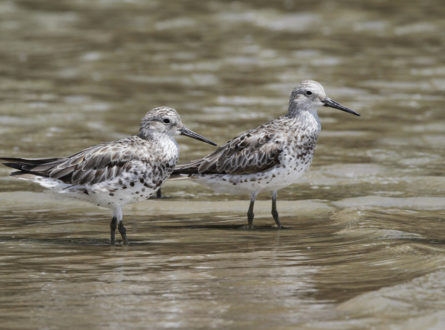
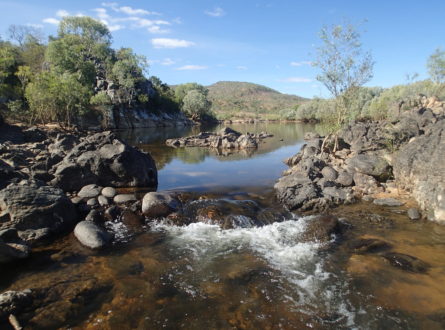
Hub research in the Gulf of Carpentaria aims to support sustainable development in the region. This includes research to inform water allocation planners and floodplain managers about the potential impacts of changes in flow on fisheries, migratory birds and biodiversity. Rivers that flow into the southern Gulf of Carpentaria are home to high-value ecosystems and support important recreational and commercial fisheries. With increasing development in the region, more information is needed to understand how future water development will impact on the health and productivity of floodplains and coastal areas.
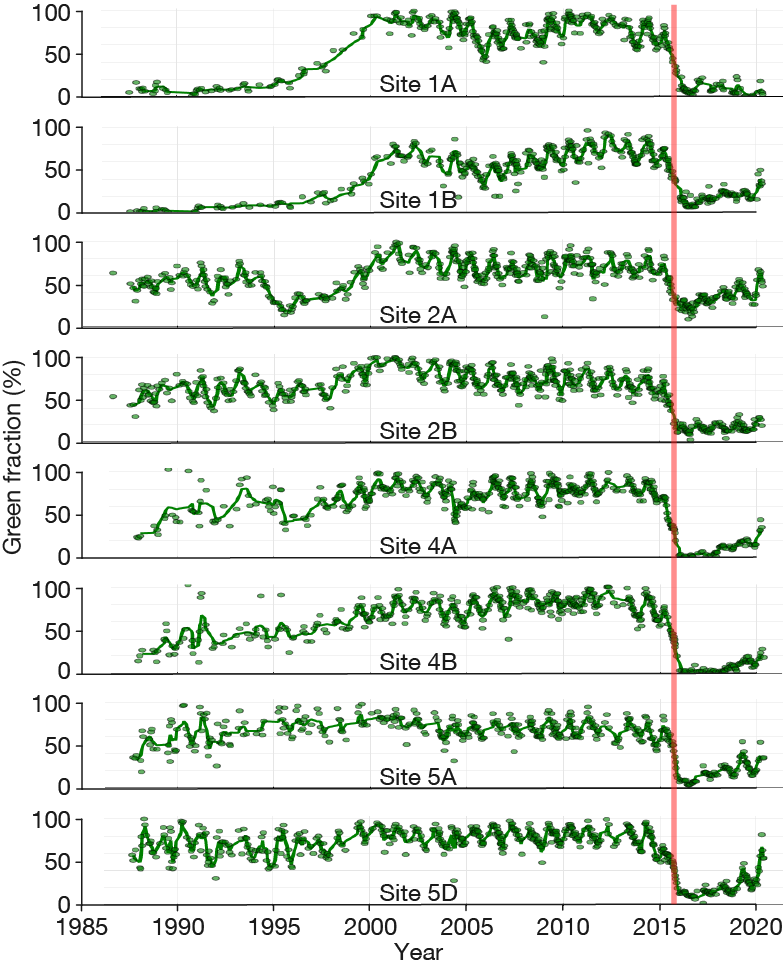
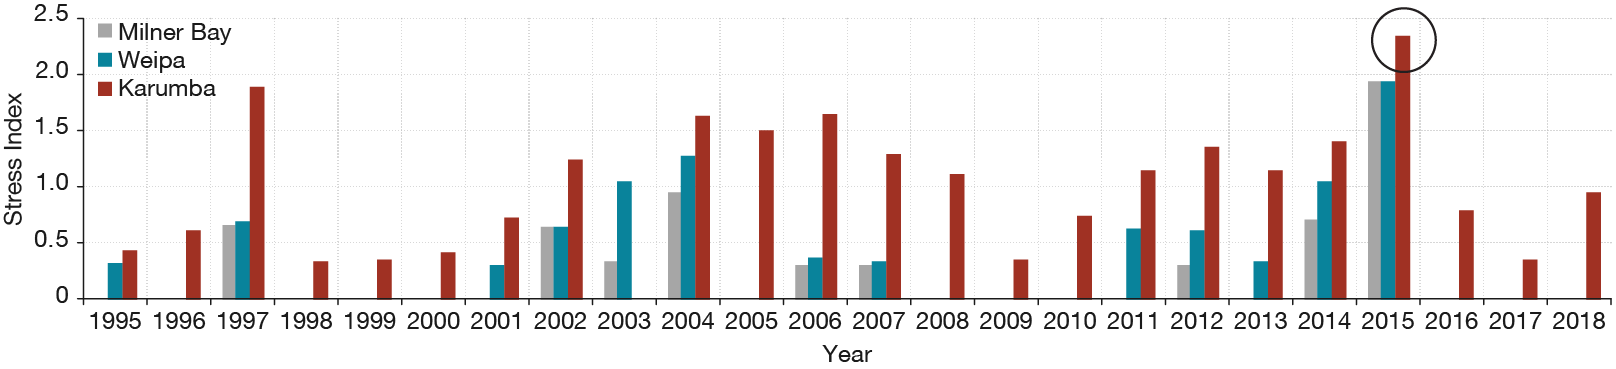
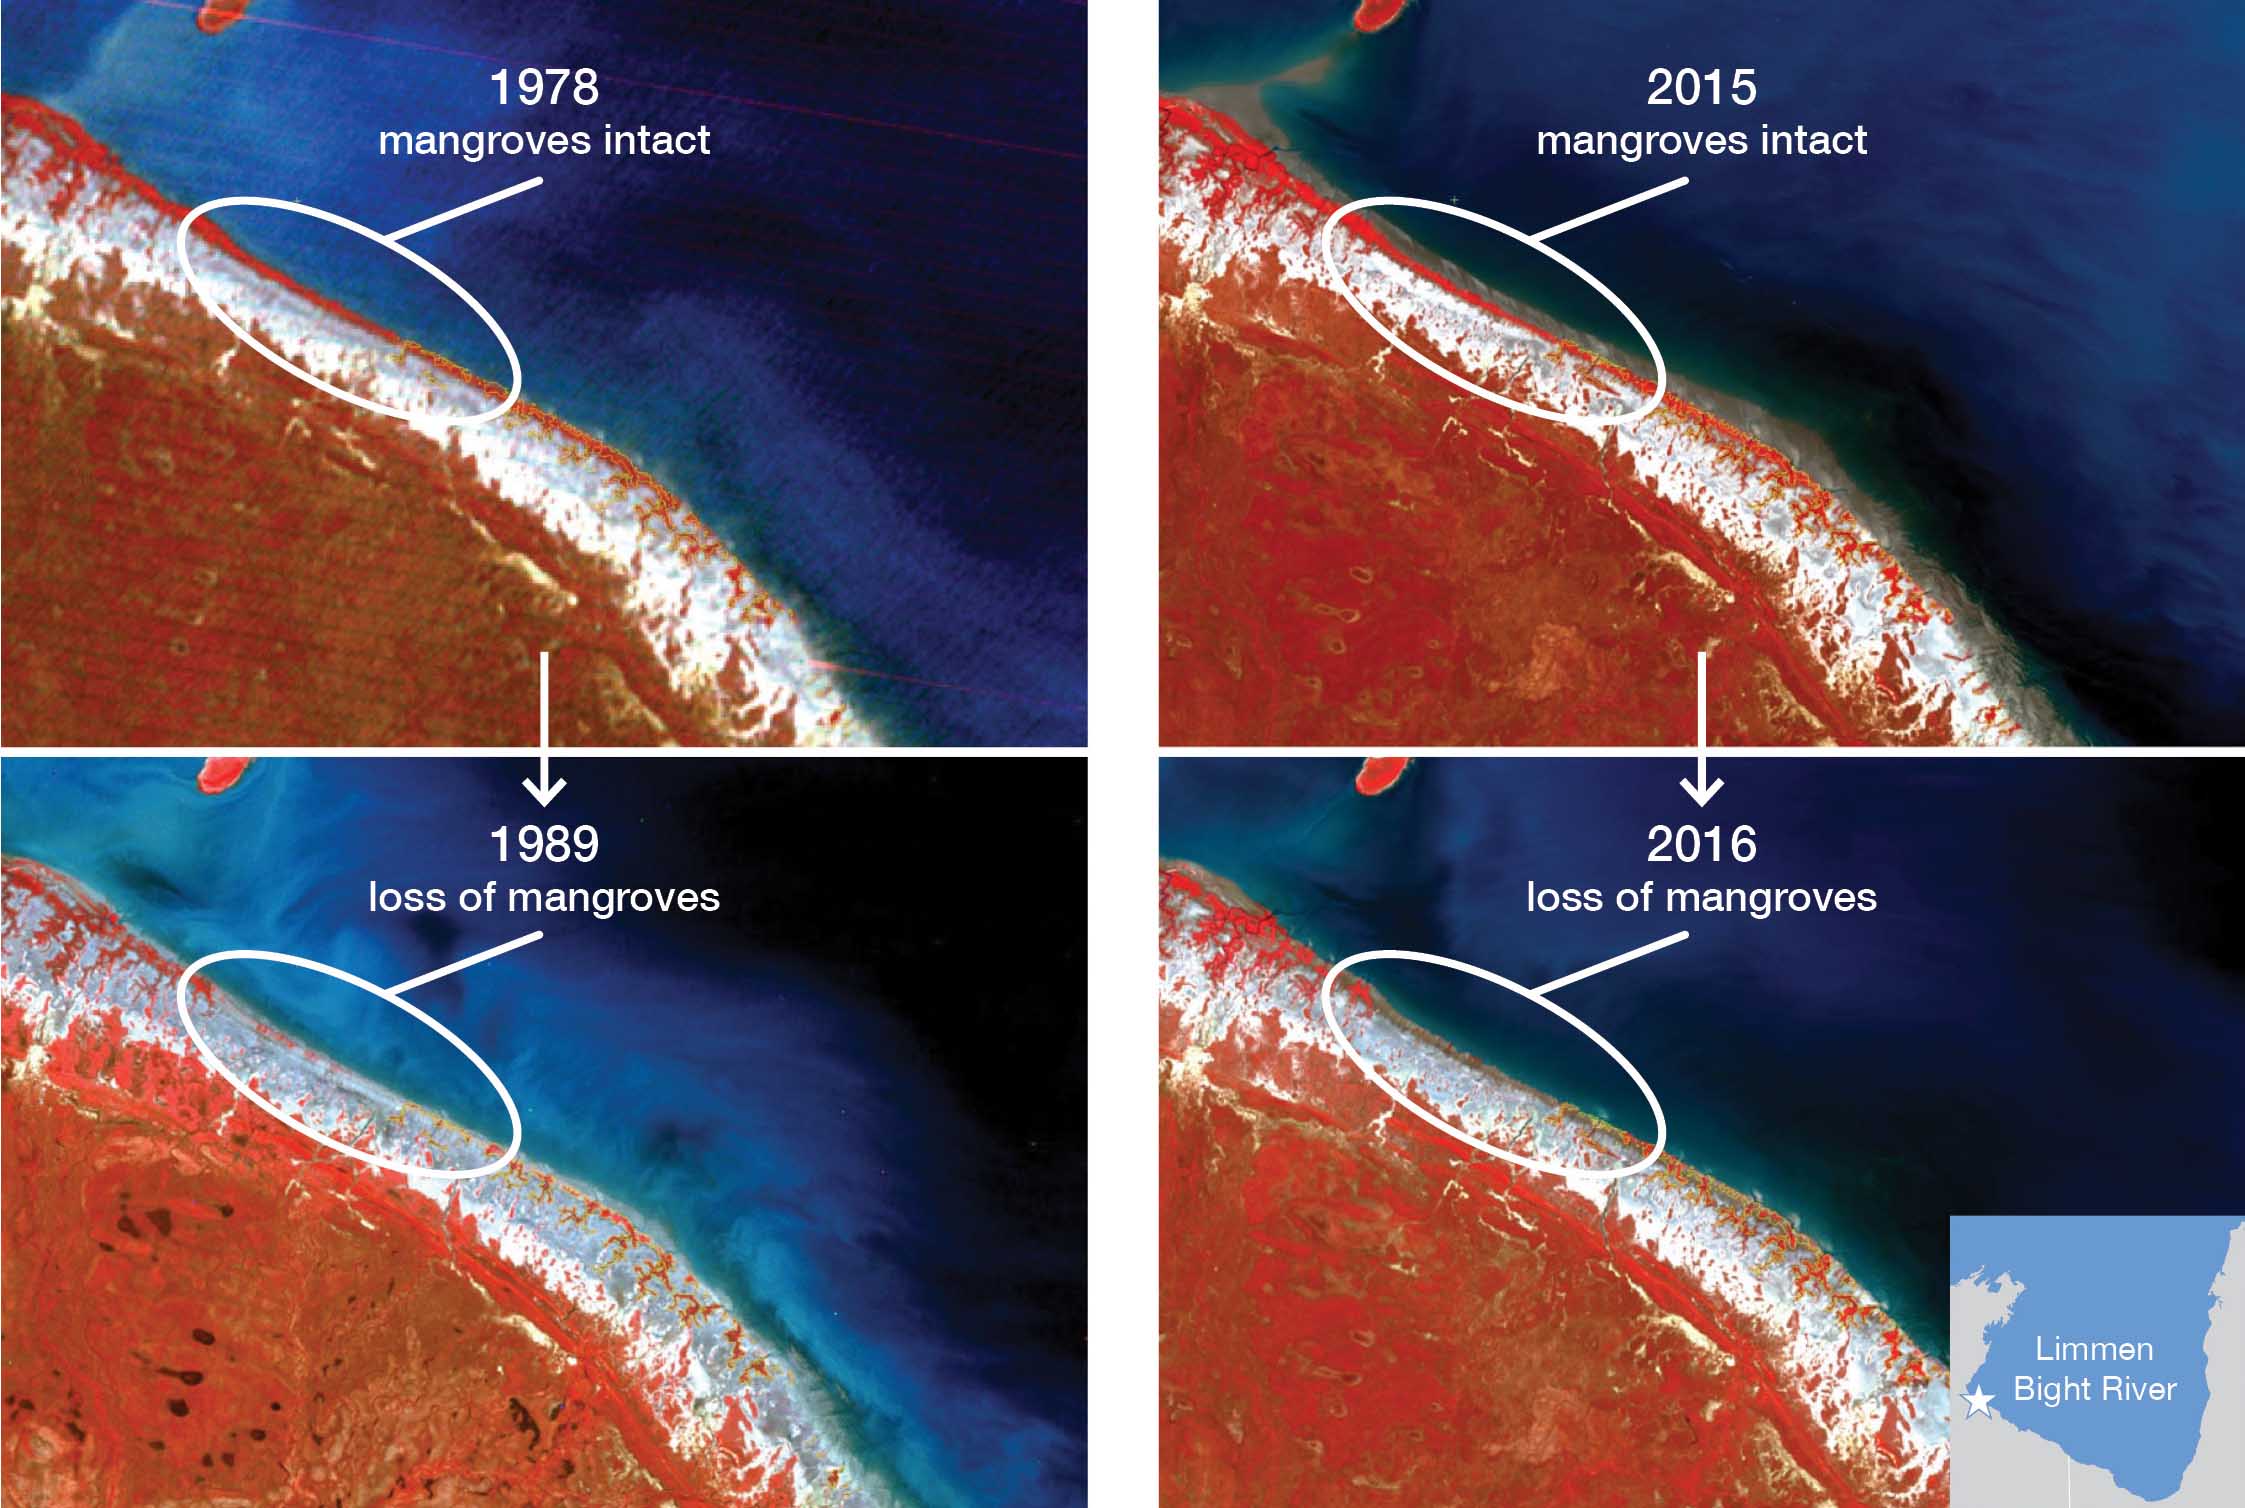
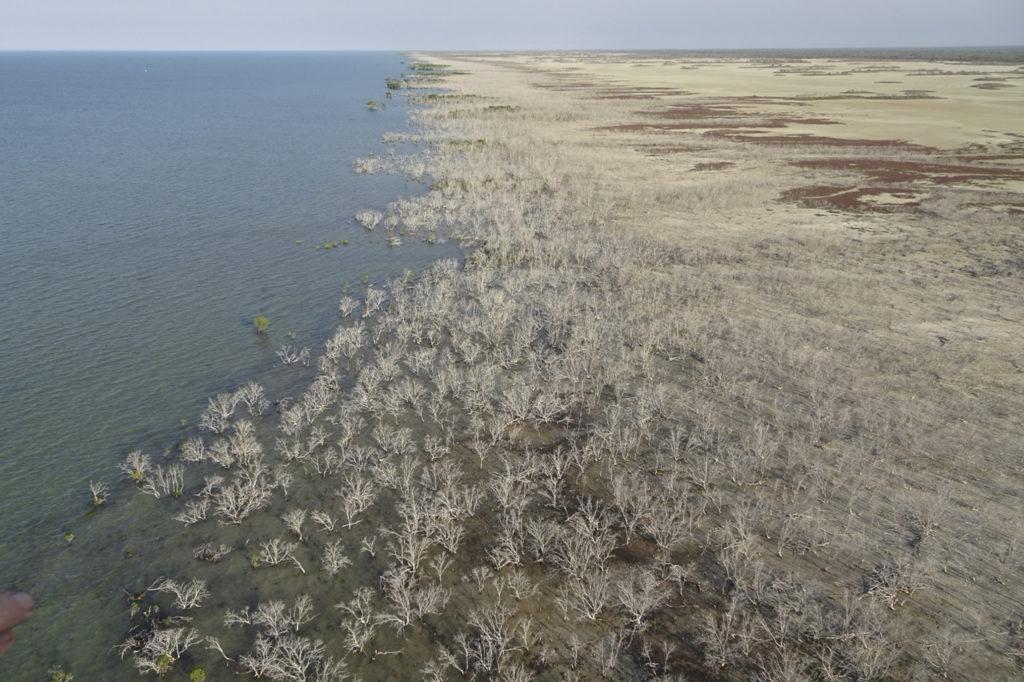
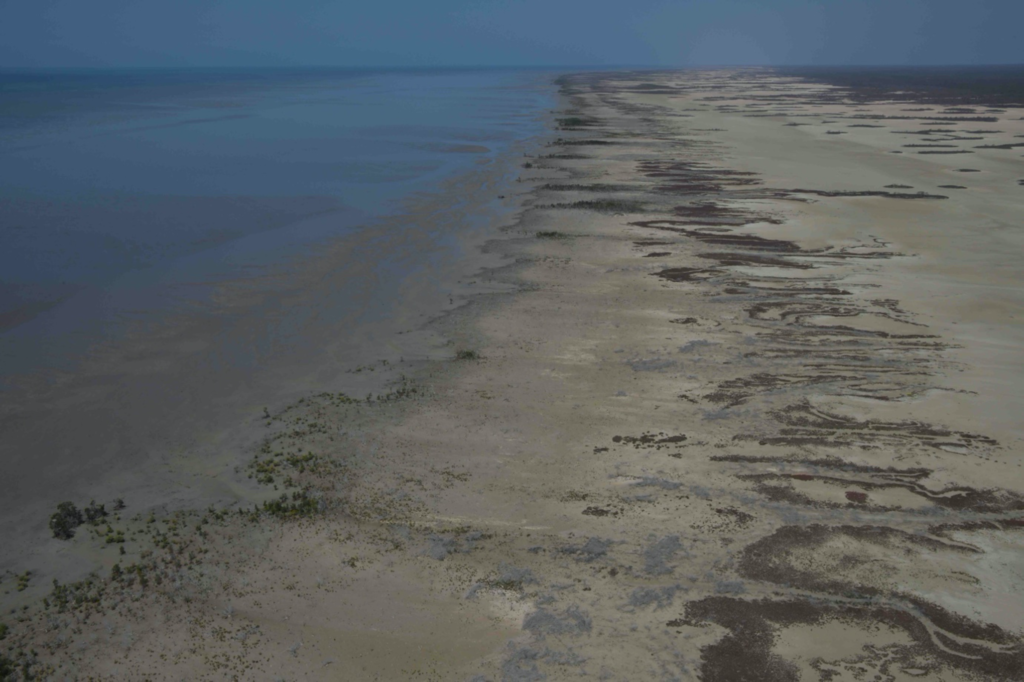
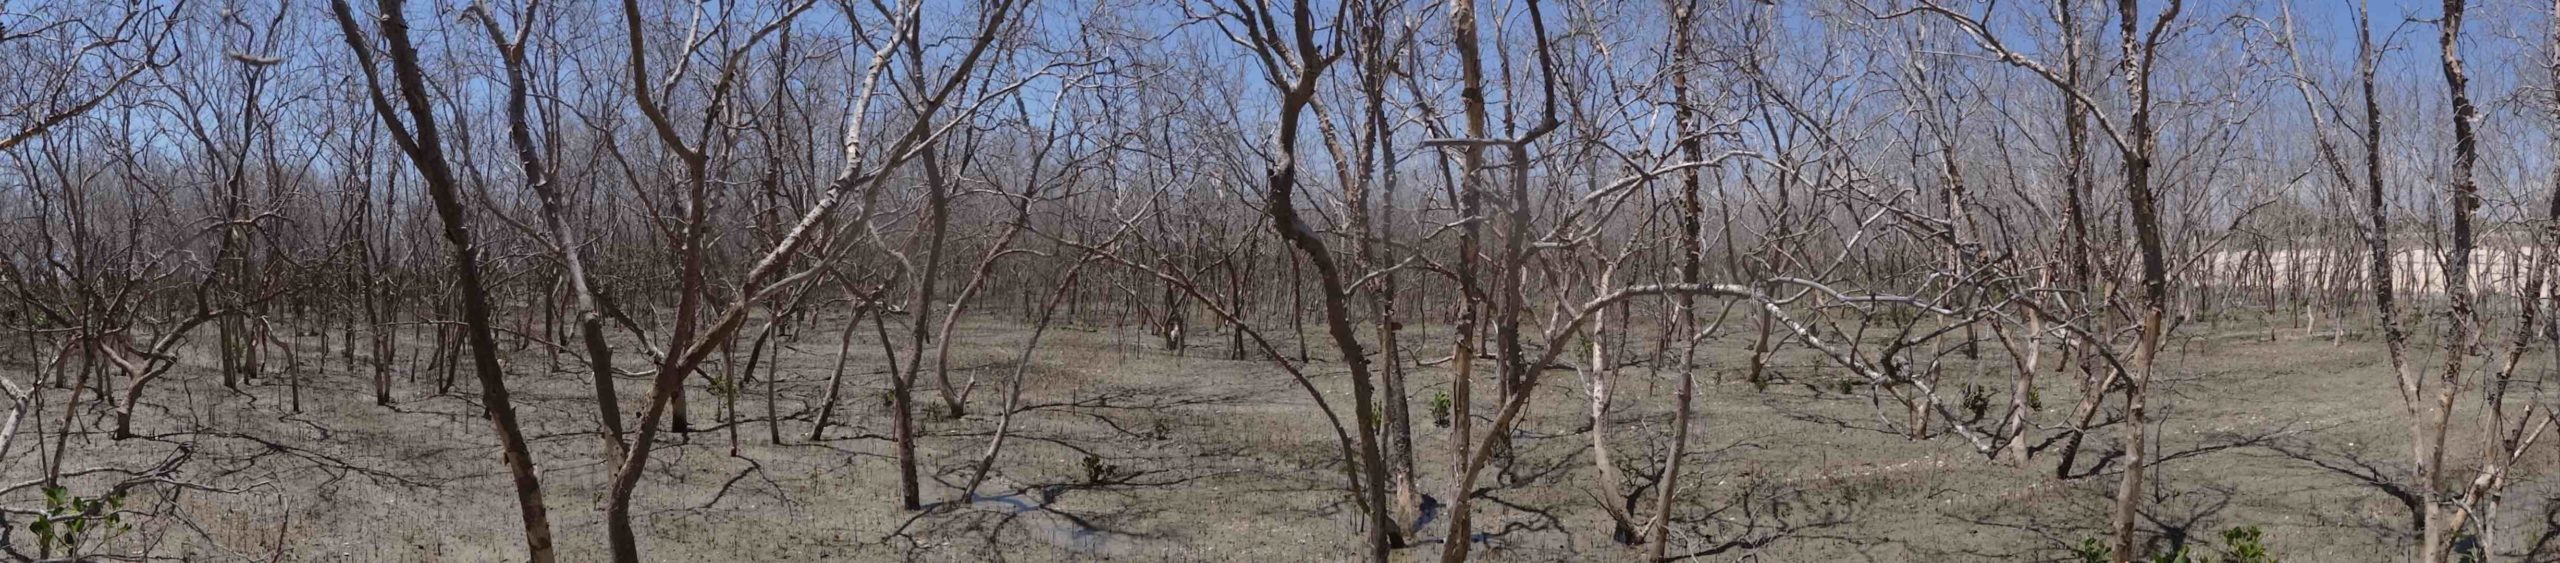
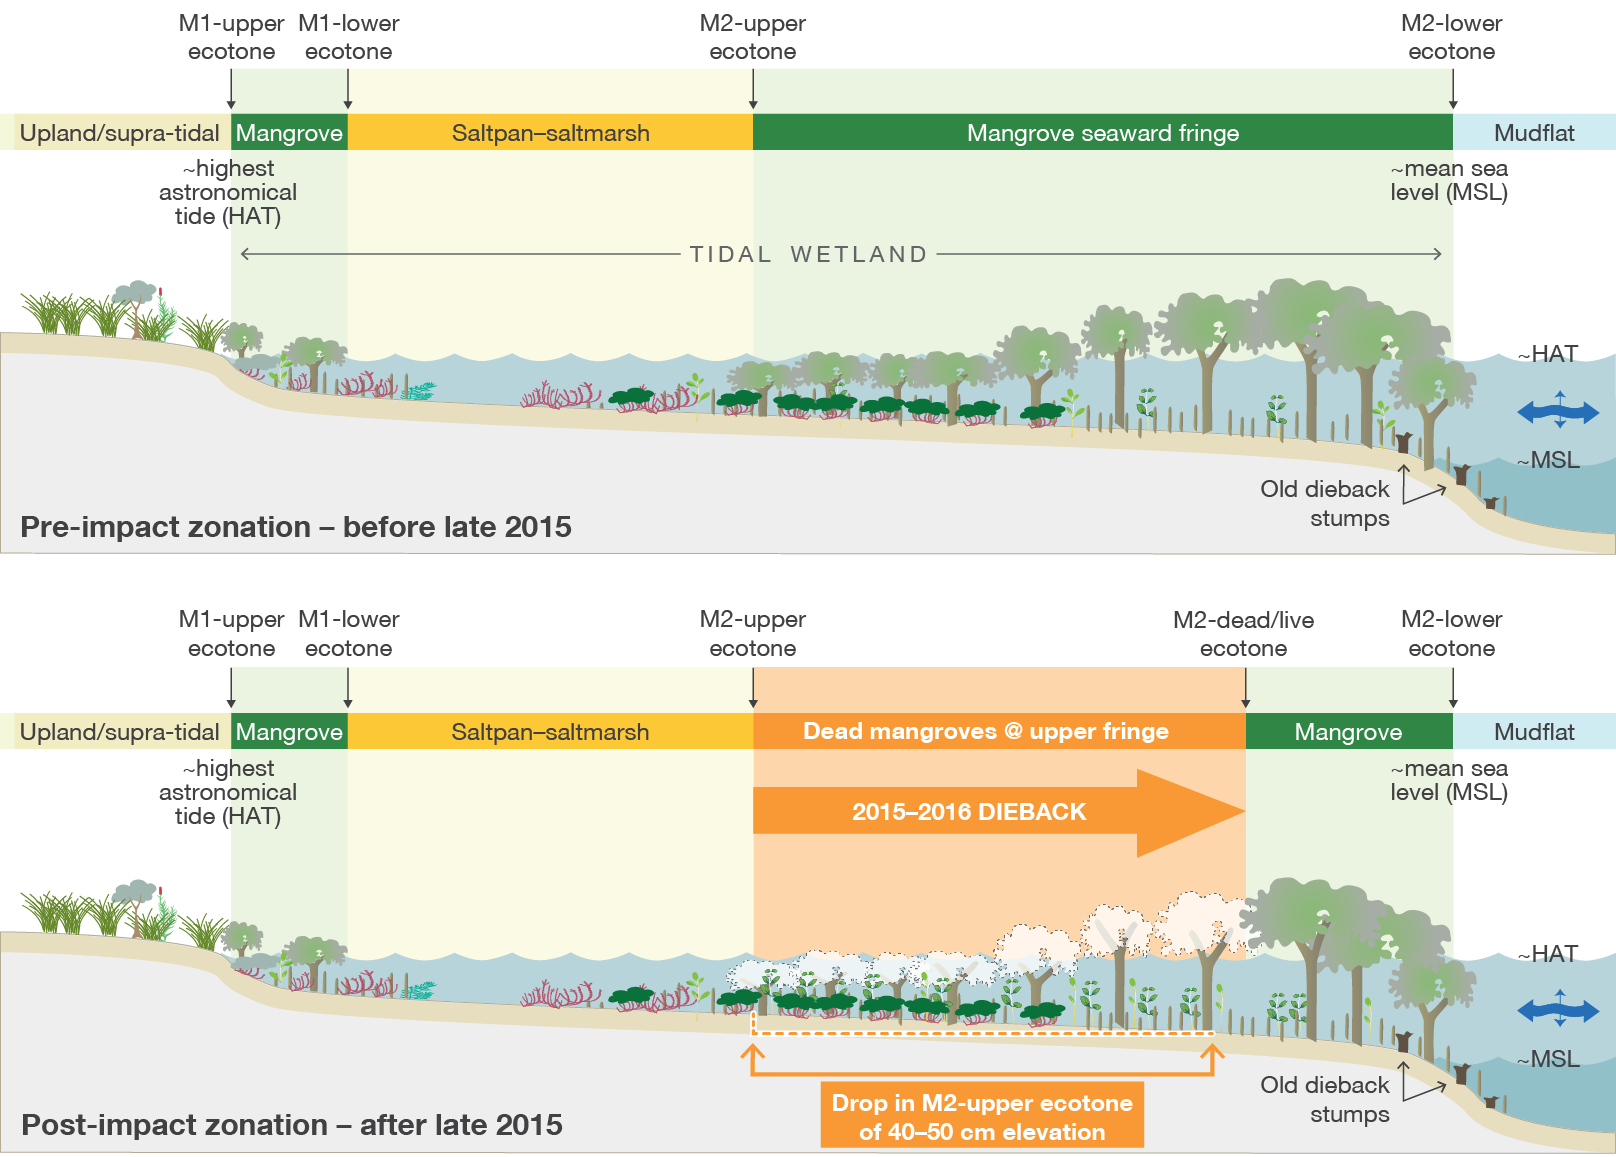
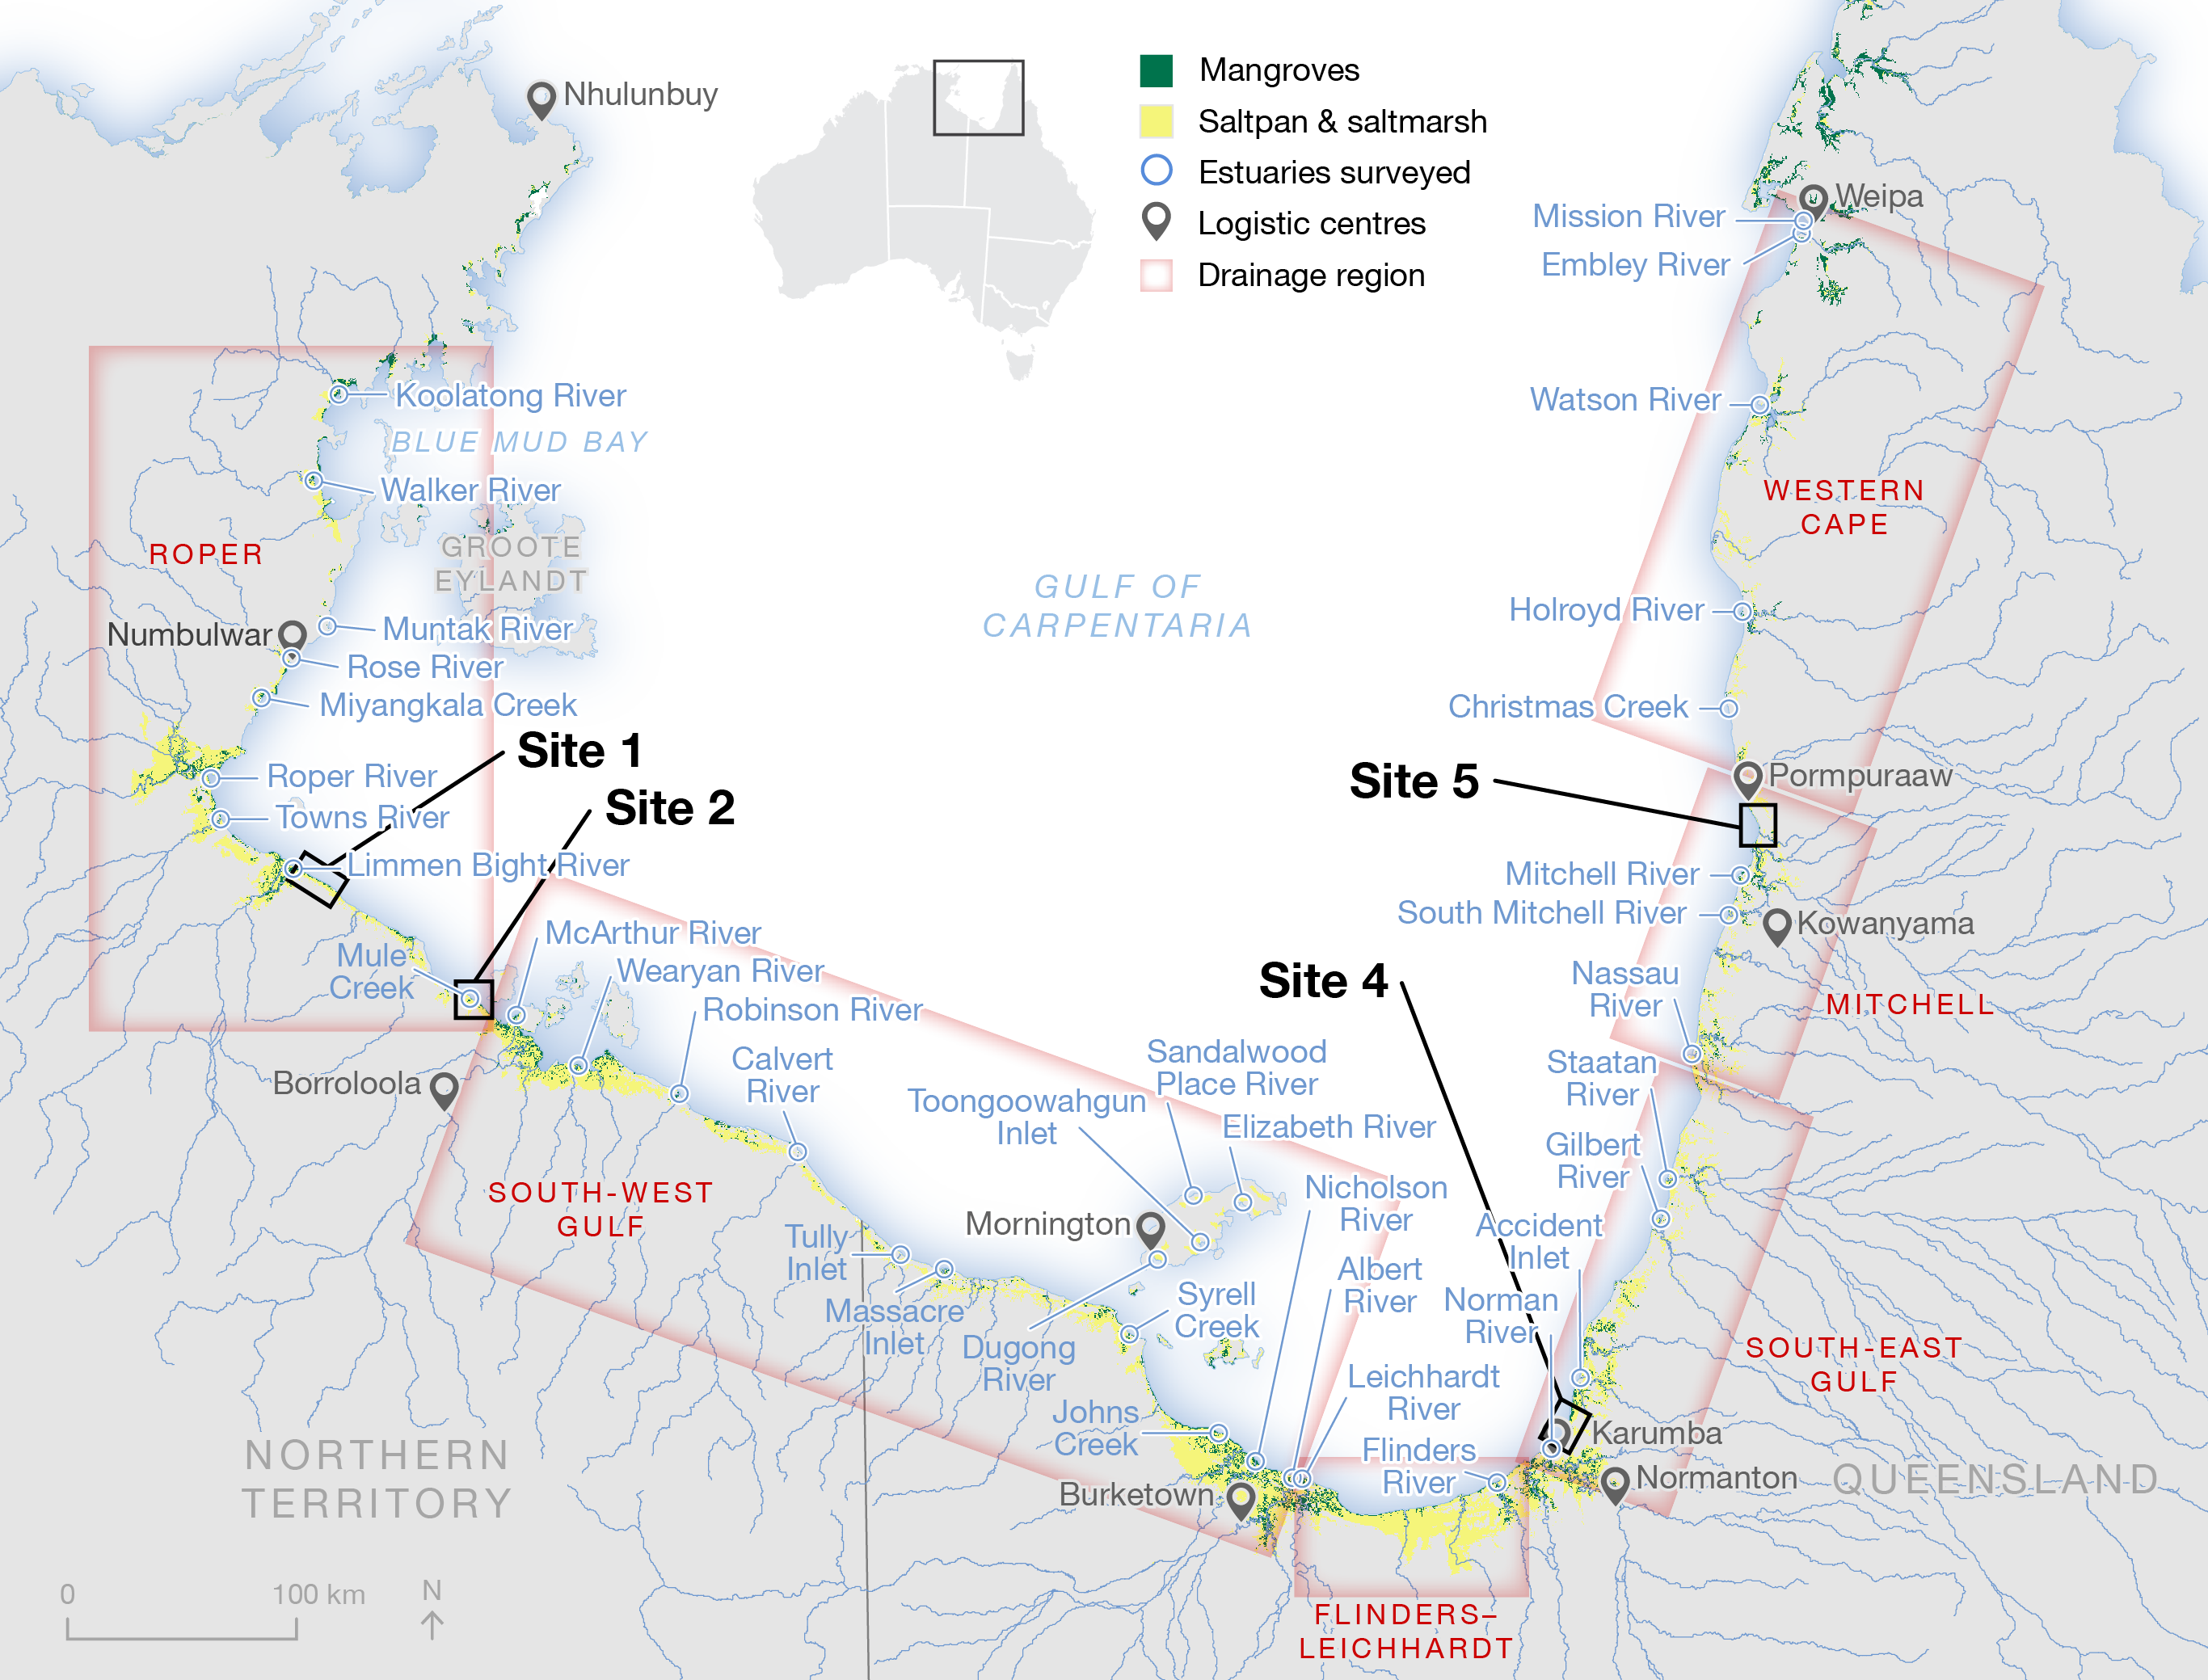
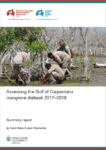
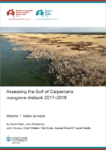
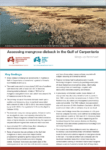
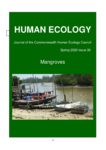
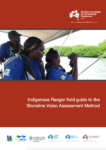
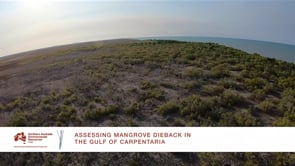
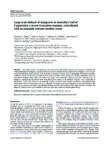
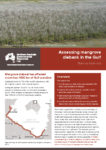
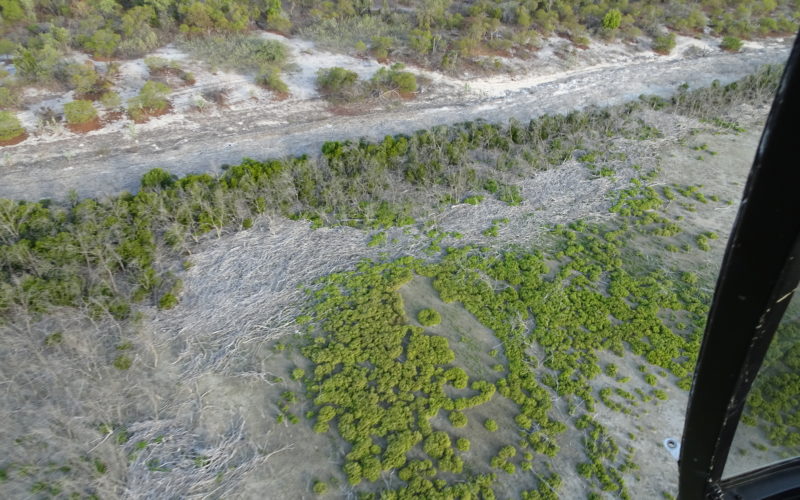
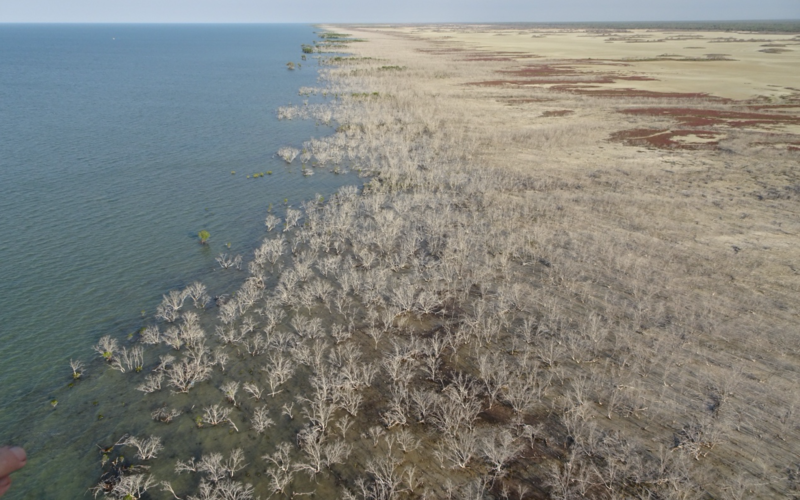
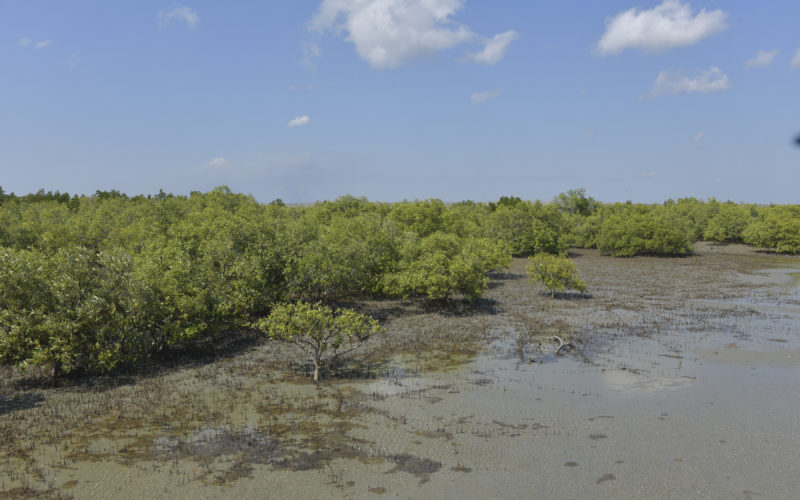
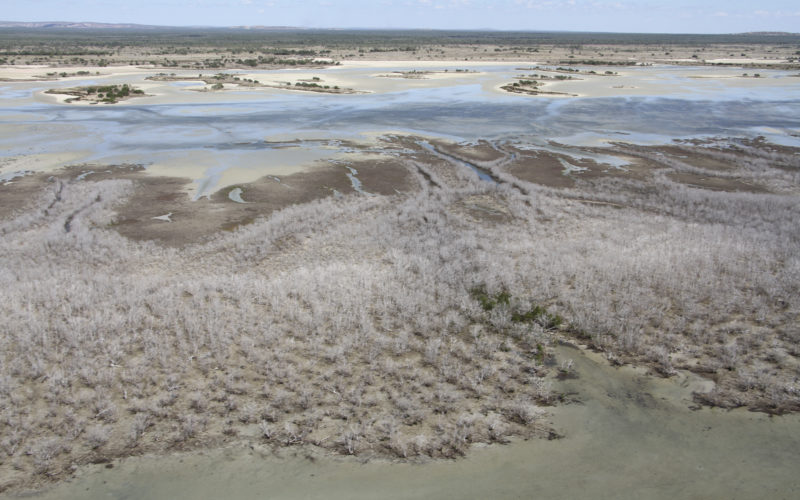
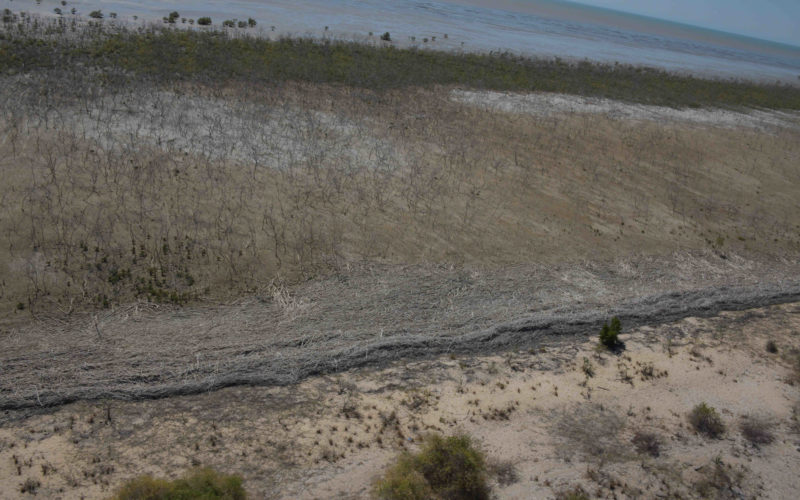
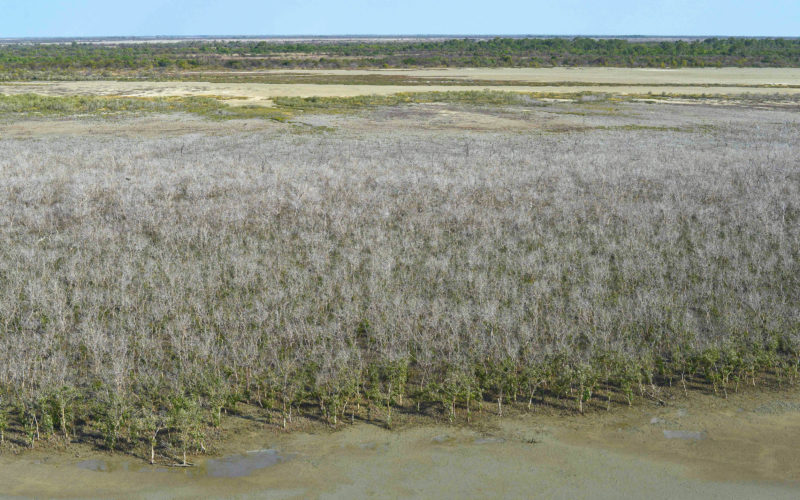
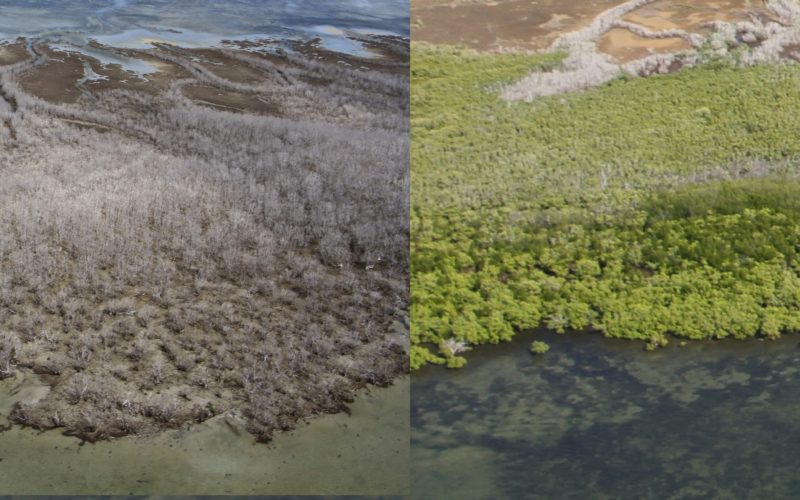
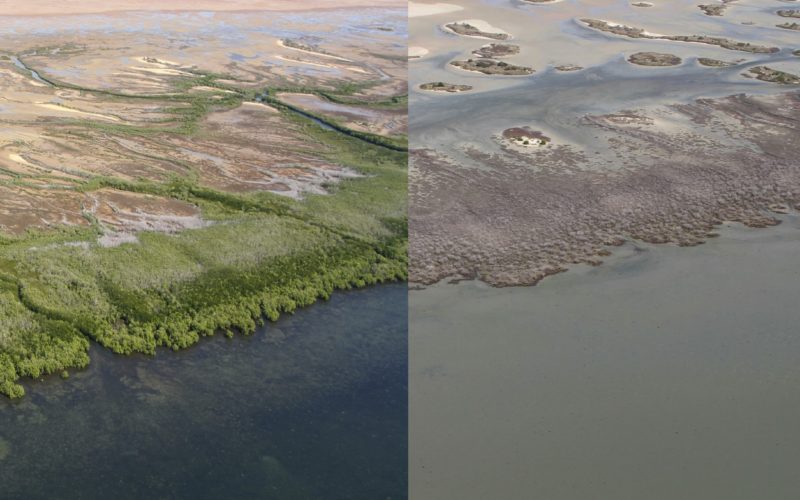
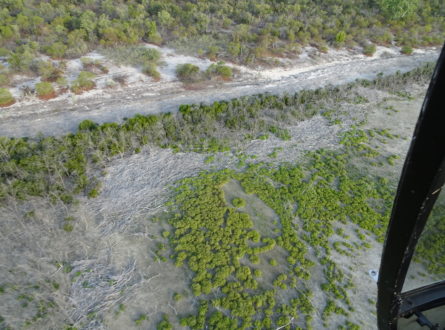
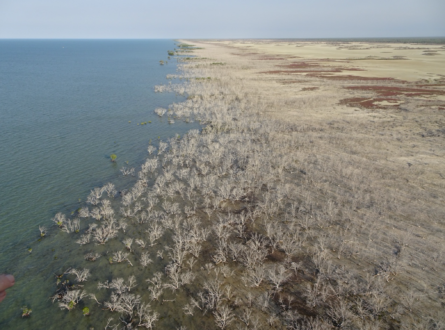
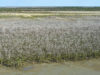
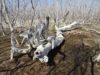
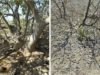
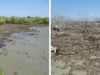
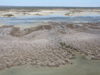
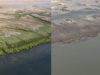
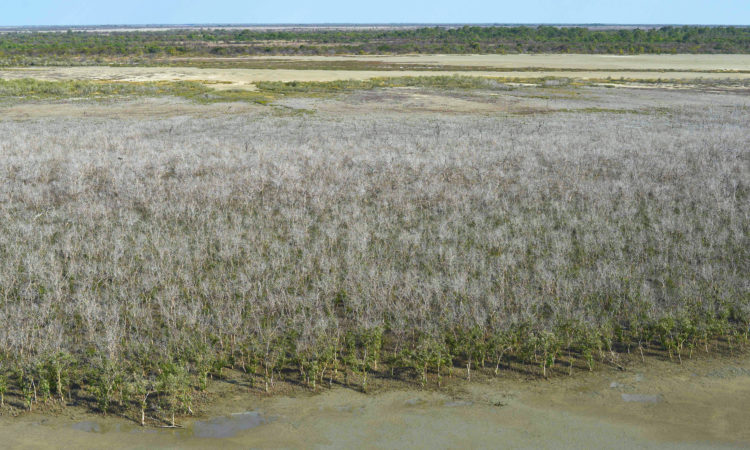
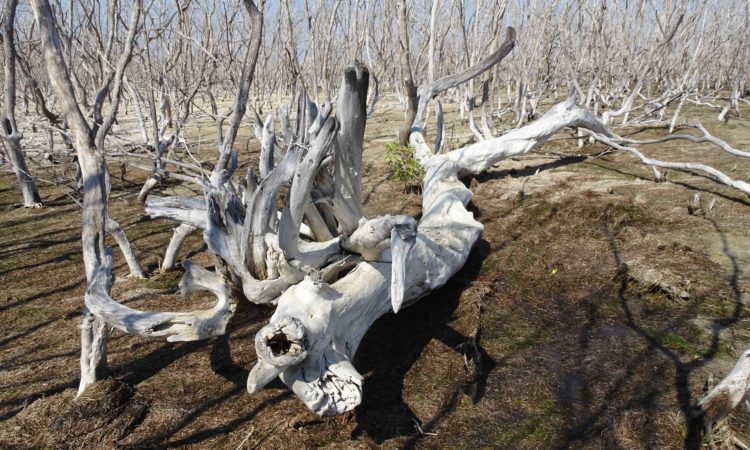
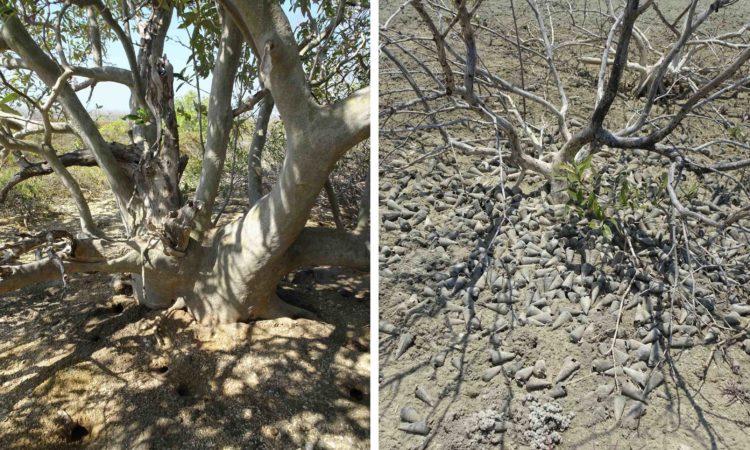
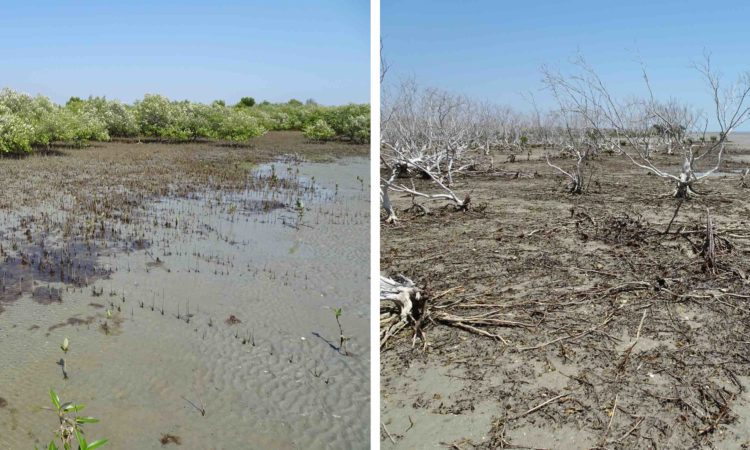
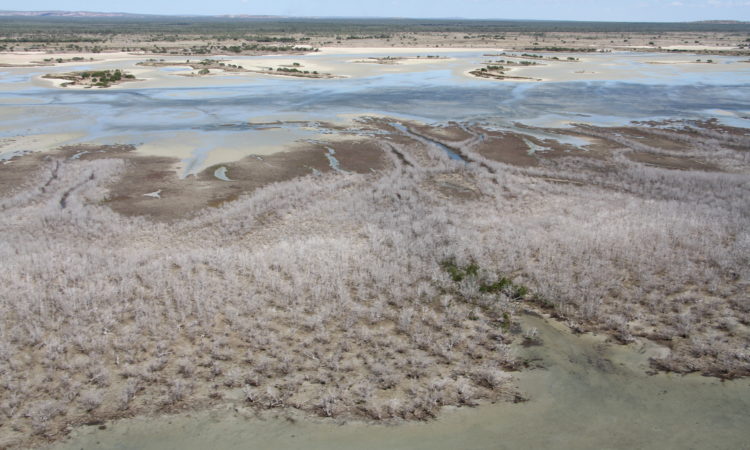
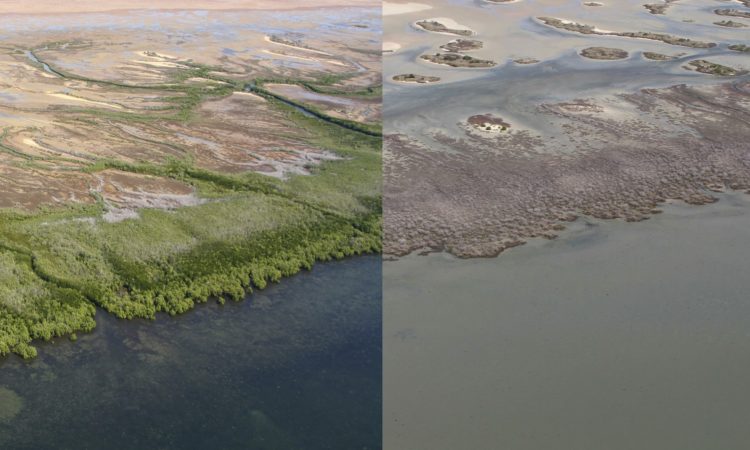
Australia is home to 7% of the world’s mangroves, mostly located in the tropics. During the summer of 2015-6, one of the worst mangrove dieback events ever recorded devastated around 7400 hectares of mangroves along more than 1000 km of Gulf of Carpentaria coastline. This project produced a field guide for Indigenous rangers to monitor mangrove condition in the Gulf.
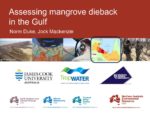
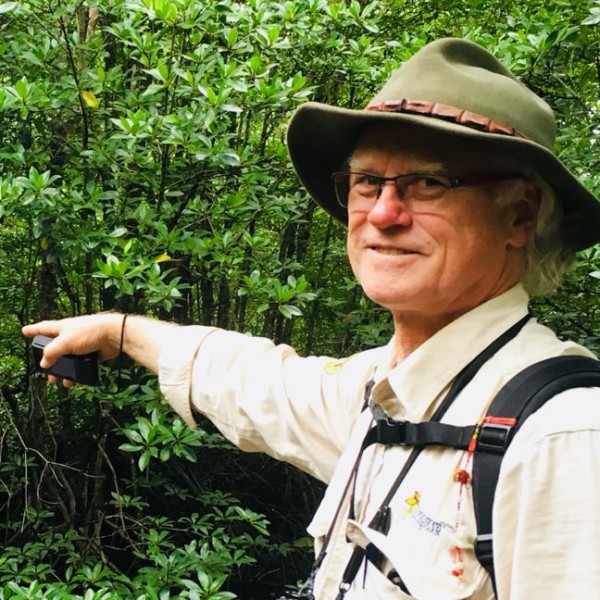
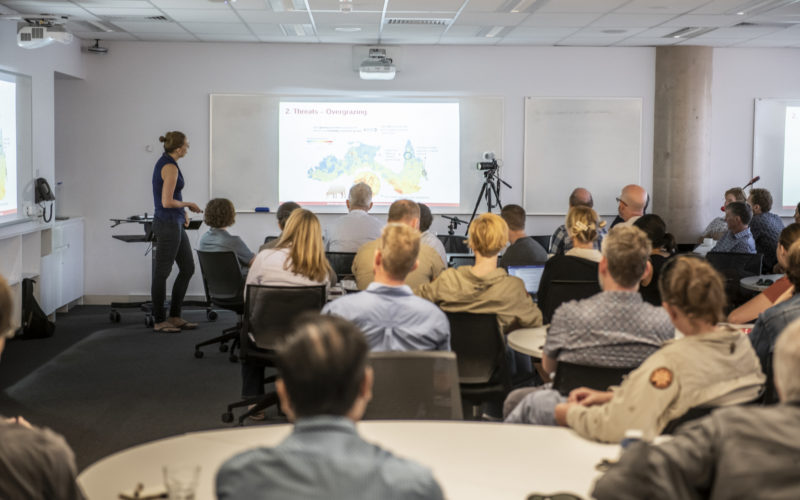
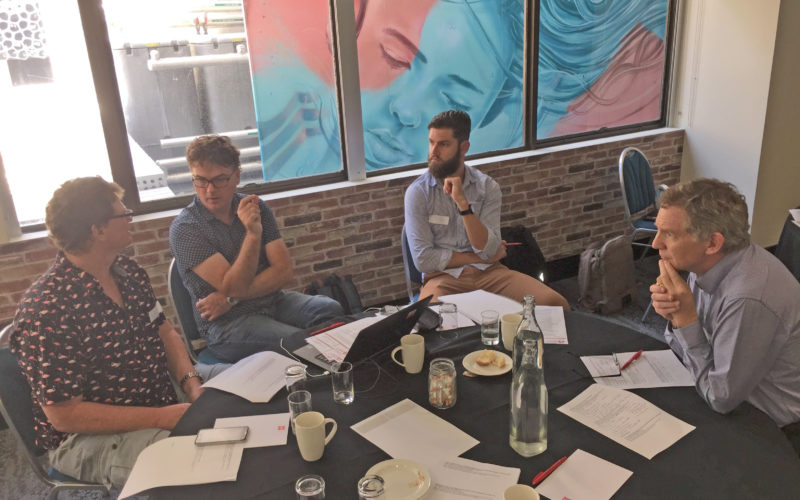
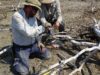
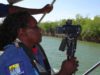
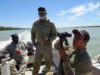
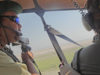
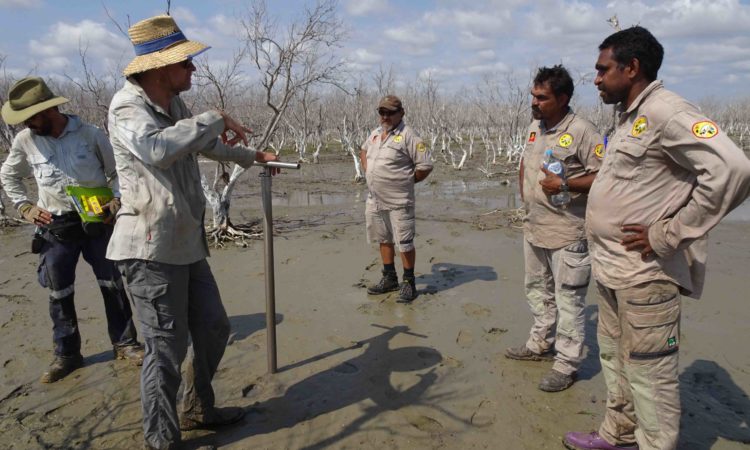
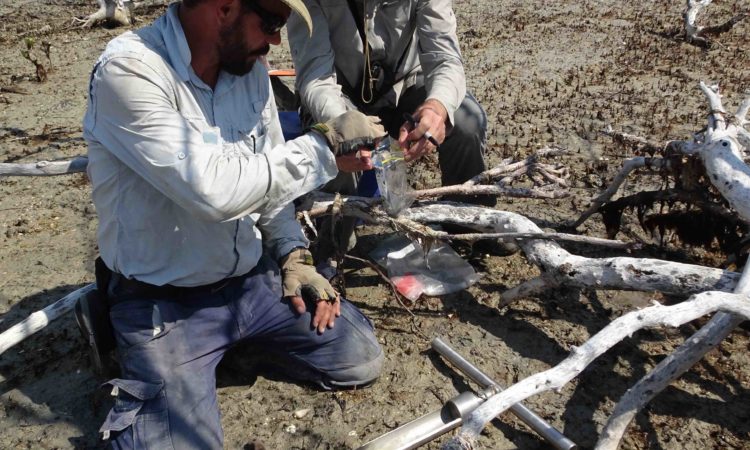
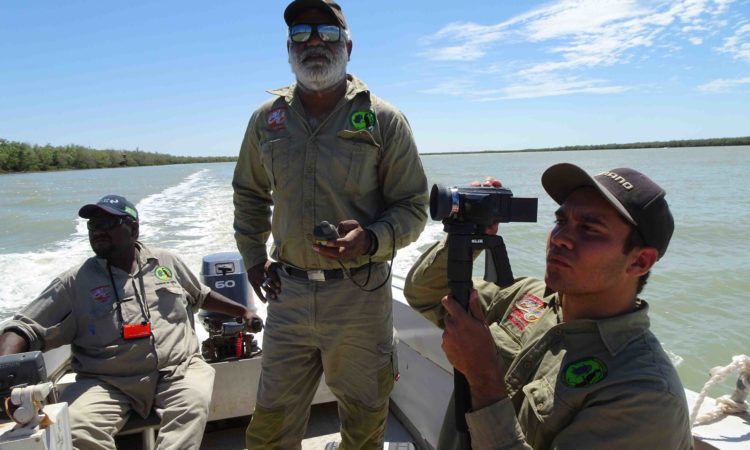
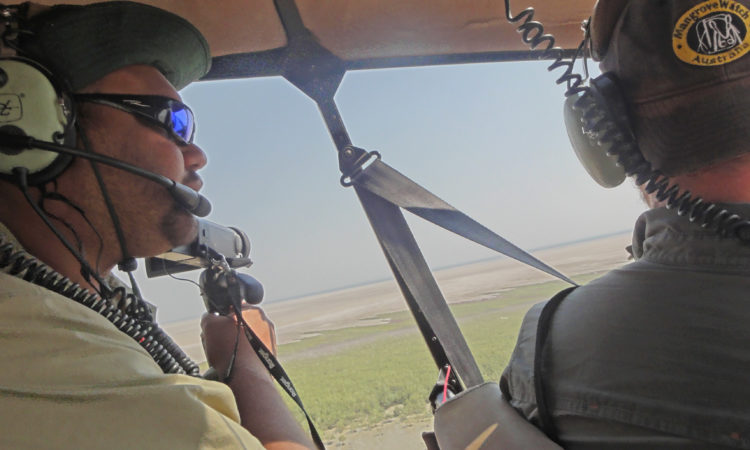
The project was led by Professor Norm Duke from James Cook University (JCU). Professor Duke was assisted by additional researchers from JCU and Indigenous ranger groups in the region.
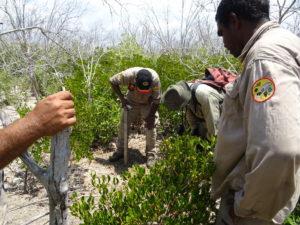
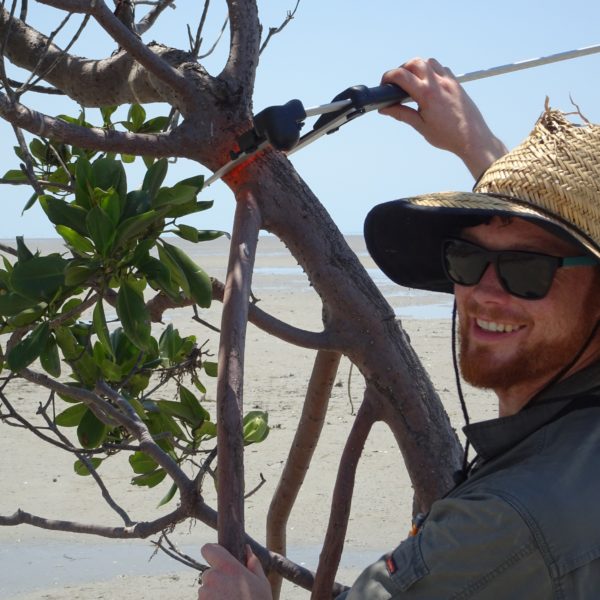
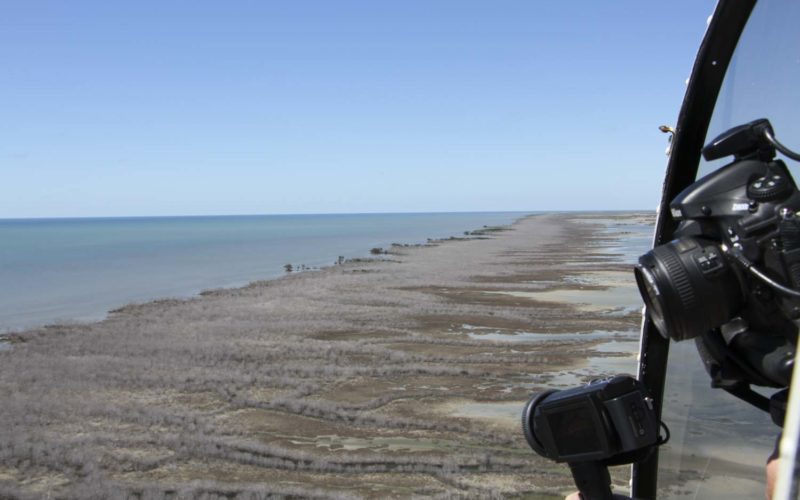
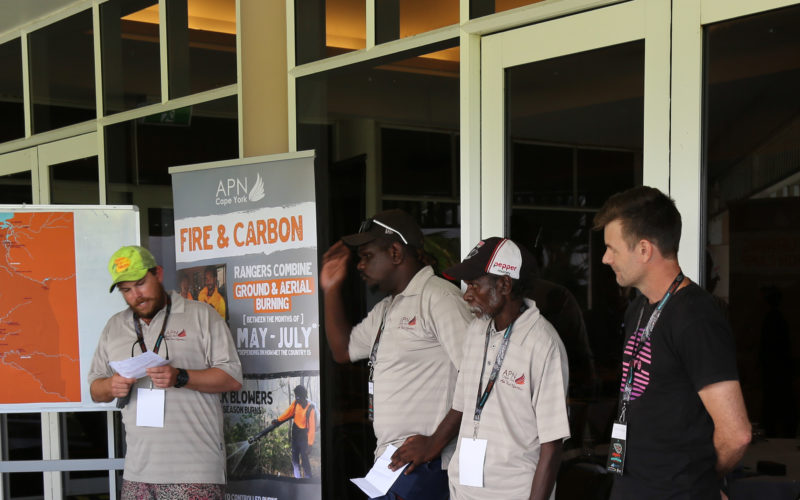
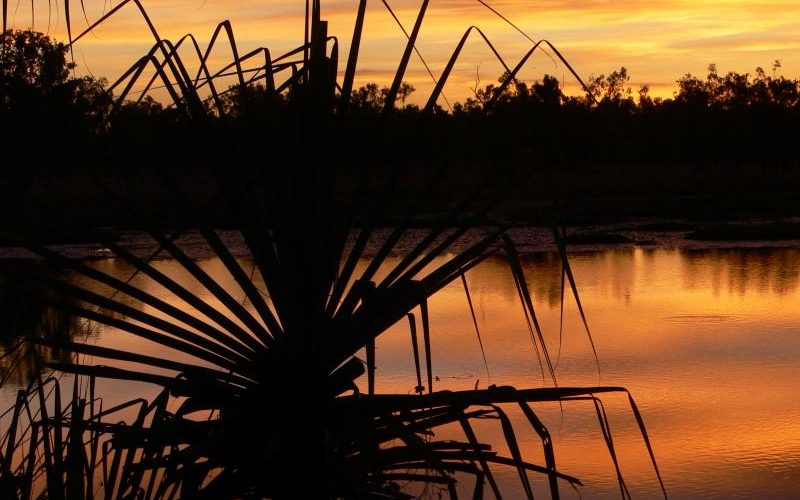
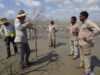
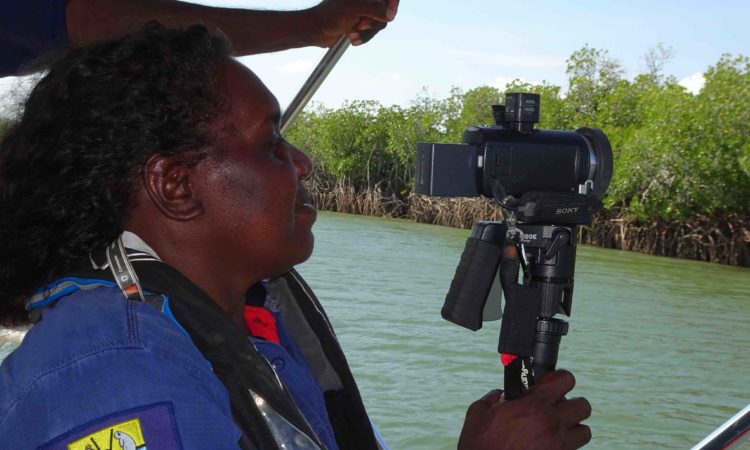
Mabunji Rangers assisting with field surveys in the NT.
For more information, visit the Mangrove Research Hub and Australian Mangrove and Saltmarsh Network websites. Survey data is available at eatlas.org.au
Contact
Norm Duke, James Cook University
[email protected]
0439 191 952
This project is also being supported by the Tropical Water Quality Hub, the Marine Biodiversity Hub and the Earth Systems and Climate Change Hub of the Australian Government’s National Environmental Science Program.